All-in-one workforce app for businesses, especially security companies.
Key features
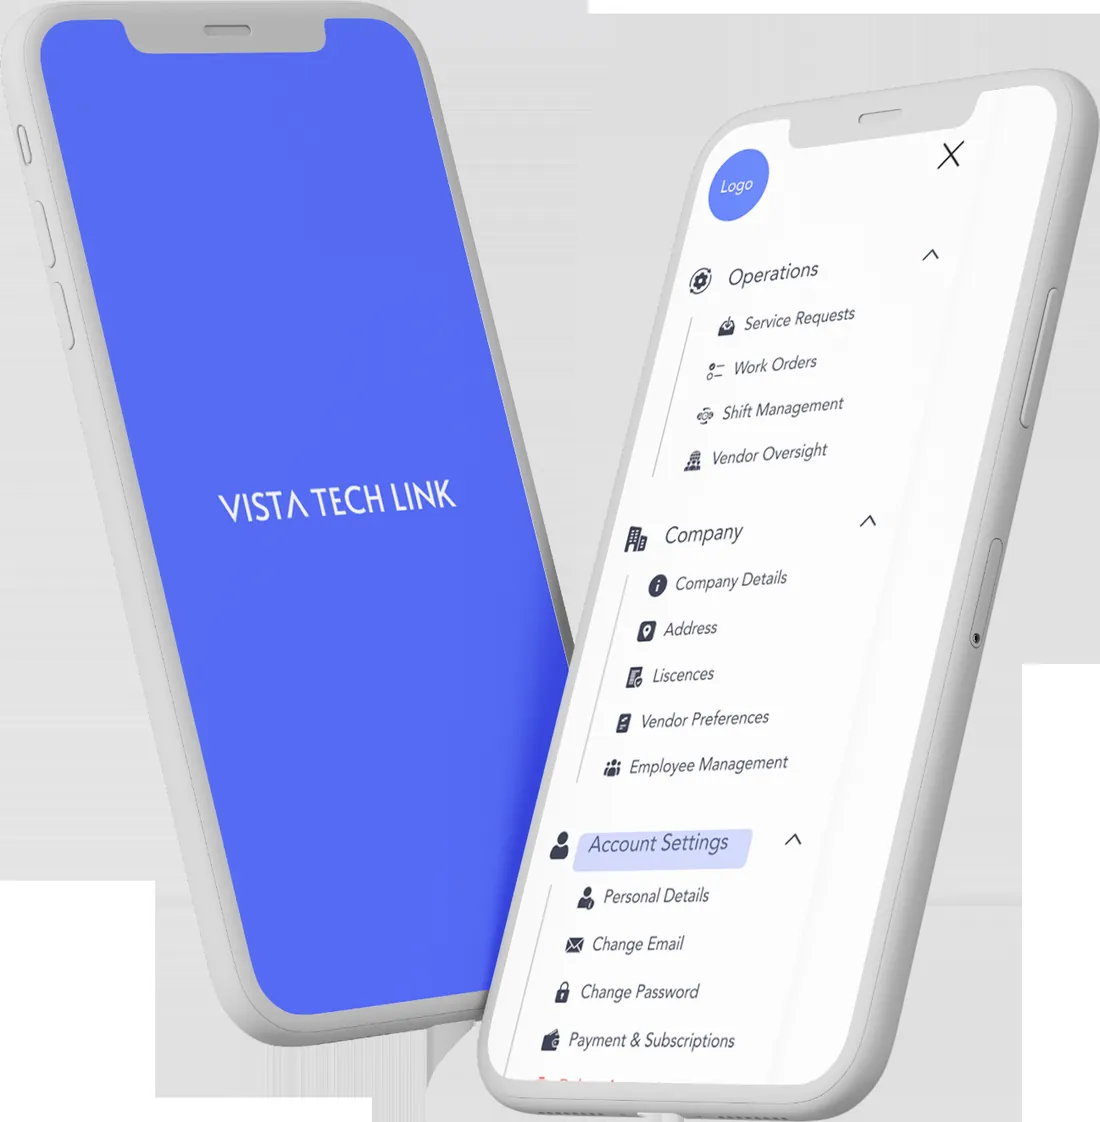
- Employee directory
- Job scheduling
- Shift management
- Time clock
- Real-time reporting
- Document management
Delivered at Doerz, the software agency Junaid founded and led as CTO (2→30 engineers, 40+ platforms).
Build something like this →